Introduction
The stage is set for another enthralling South Coast Derby as AFC Bournemouth prepares to host Brighton & Hove Albion. This fixture always promises drama, tactical battles, and passionate support, making it a highlight for fans and football analysts alike. As both teams vie for crucial points, understanding their historical encounters, current form, and underlying statistics becomes paramount for predicting the outcome.
This comprehensive match preview for the Bournemouth vs Brighton clash delves deep into the data, offering an analytical perspective on what to expect. From head-to-head records to recent performance trends and key statistical comparisons, we”ll equip you with all the insights needed to appreciate this exciting encounter and inform your betting decisions.
Head-to-Head Record
The rivalry between AFC Bournemouth and Brighton & Hove Albion has forged a history of closely contested matches. Their encounters often reflect a battle for regional supremacy, with neither side willing to concede an inch. A detailed look at their historical statistics reveals a fascinating parity that sets the stage for yet another tight fixture.
Historic Meetings
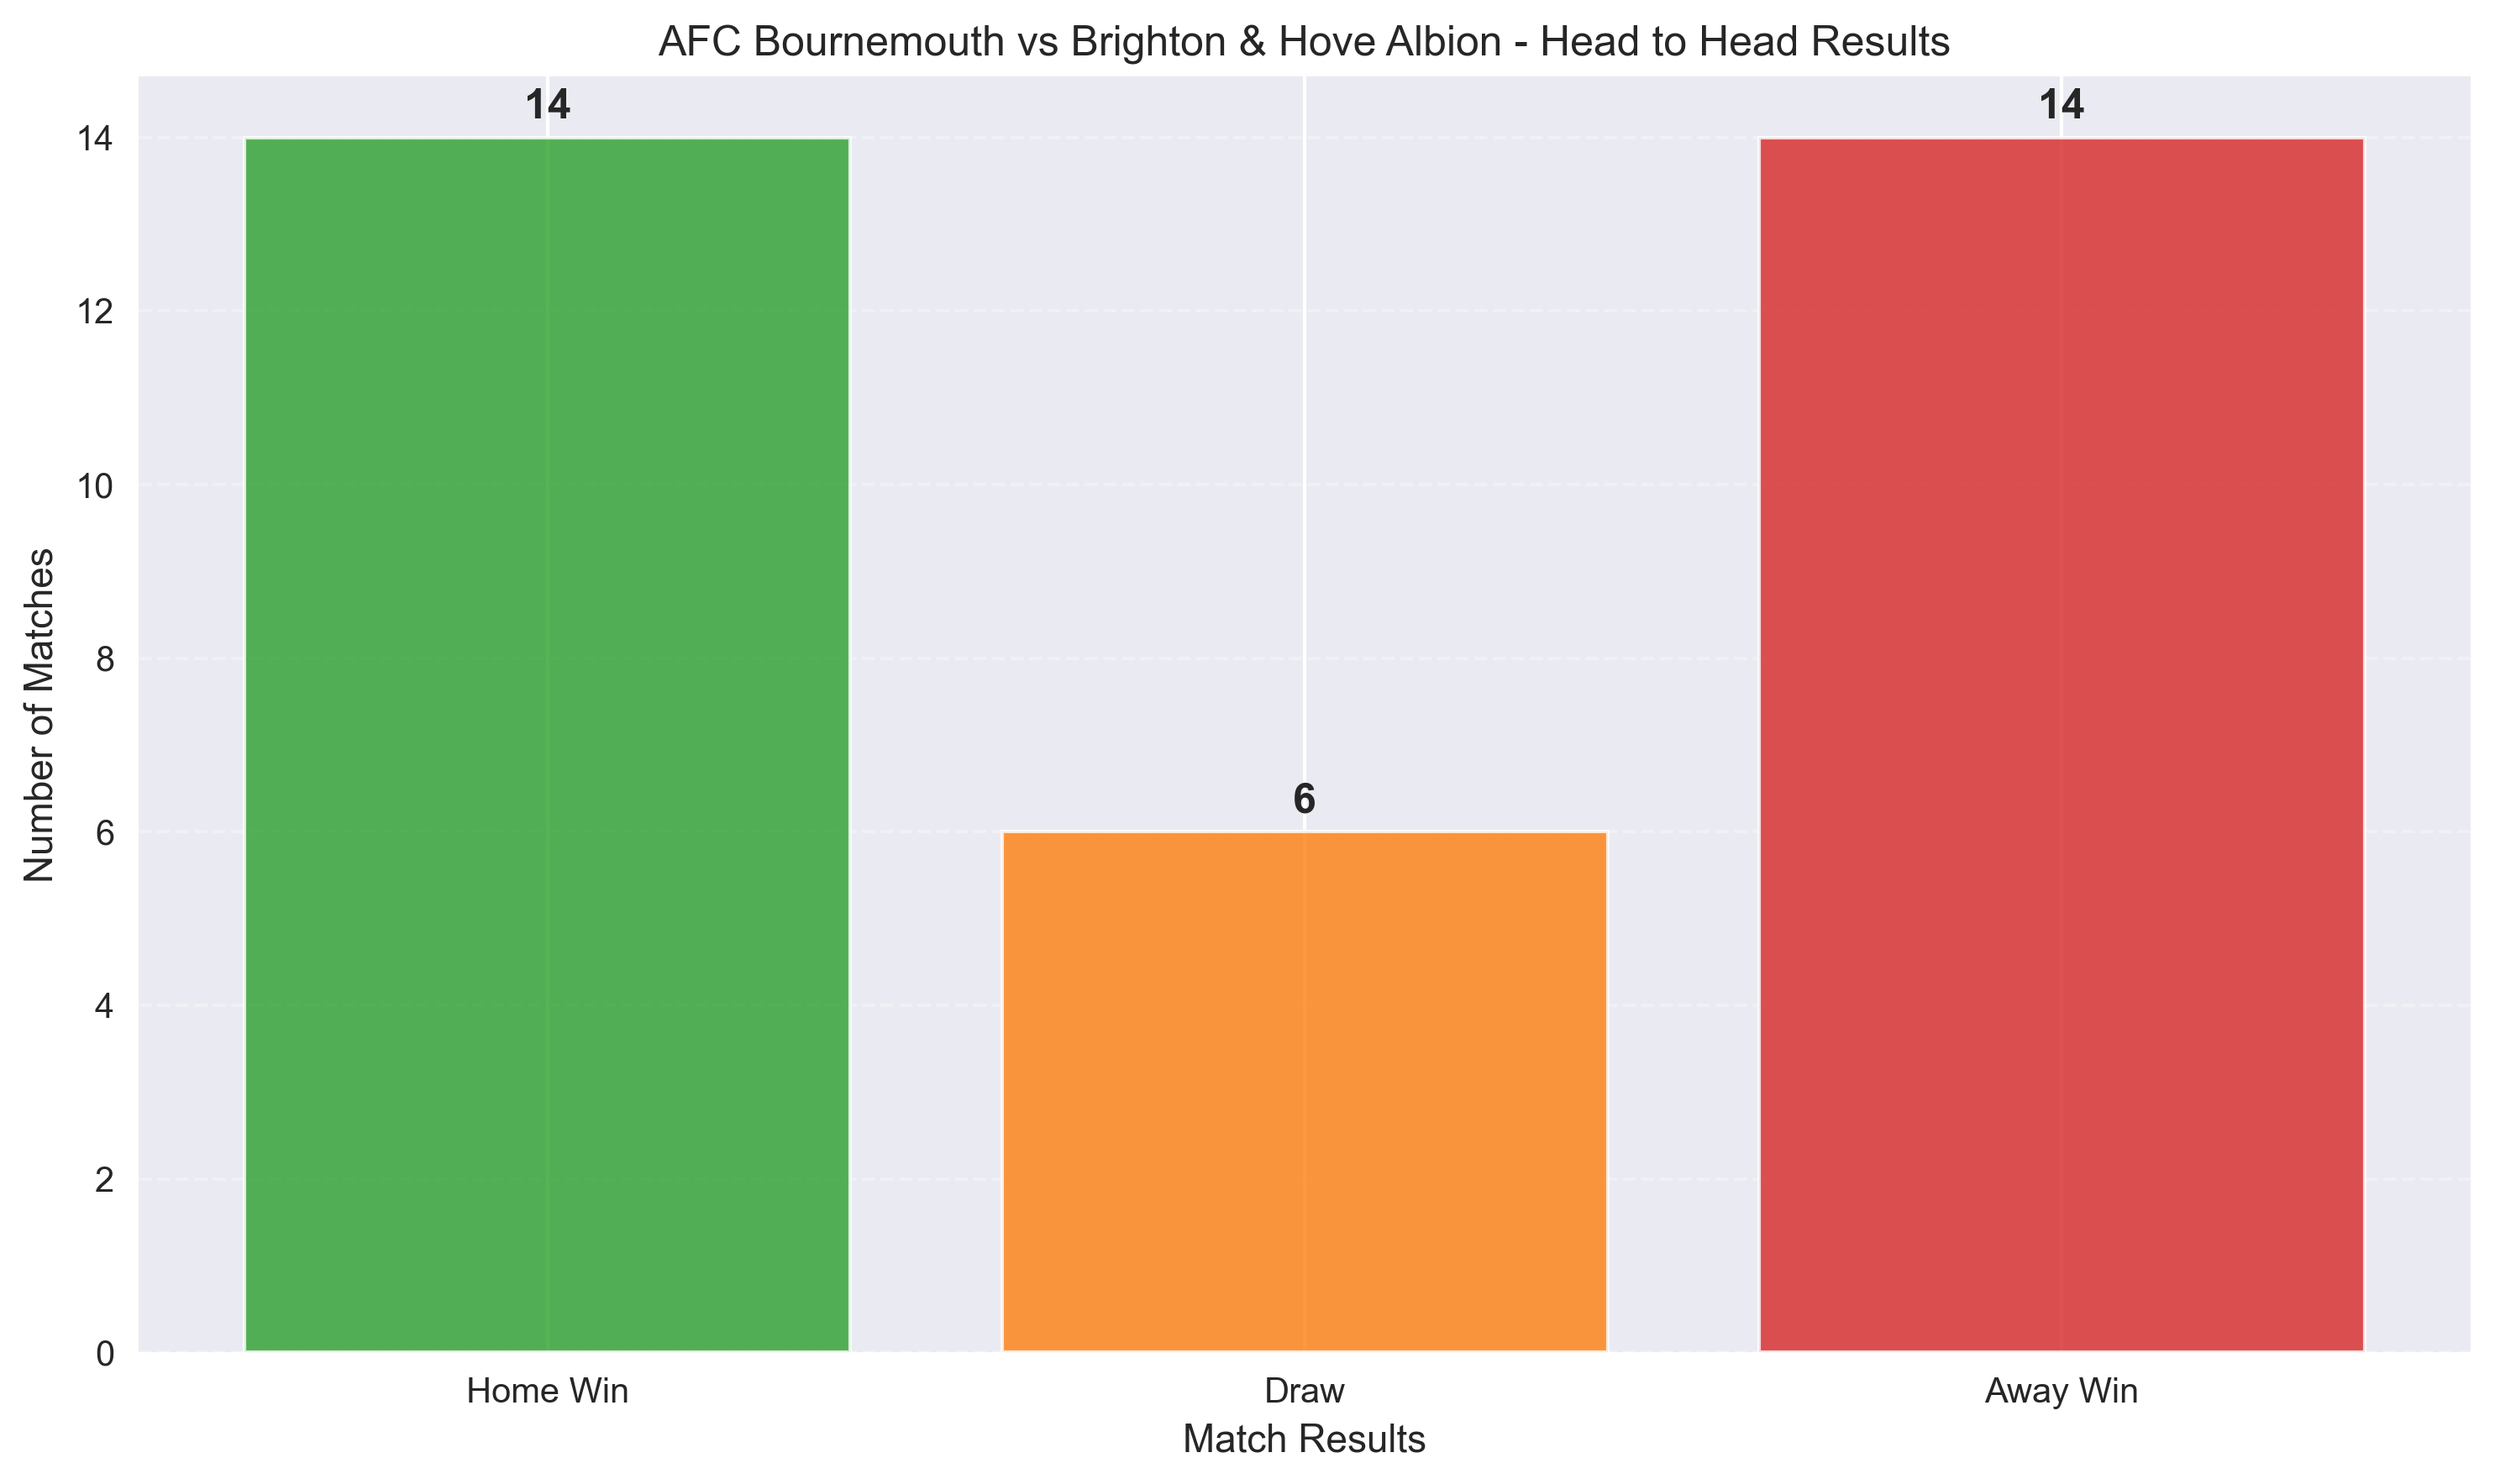
Across all competitions, these two clubs have met 34 times, resulting in an almost perfectly balanced record. Each team boasts 14 victories, showcasing the intense competitiveness that defines this South Coast Derby. Six matches have ended in a draw, further emphasizing the even nature of their rivalry.
When Bournemouth plays at home, the Cherries have historically enjoyed a significant advantage. Their home ground has proven to be a fortress against Brighton, contributing heavily to their overall win count. Conversely, their trips to Brighton have been considerably more challenging, highlighting the importance of home advantage in this fixture.
| Statistic | Value |
|---|---|
| Total Matches | 34 |
| AFC Bournemouth Wins | 14 (41.2%) |
| Brighton & Hove Albion Wins | 14 |
| Draws | 6 |
AFC Bournemouth Home Record vs Brighton
Playing on home turf provides AFC Bournemouth with a distinct psychological and statistical edge. They have converted their home advantage into a strong record against Brighton, making their stadium a difficult place for the Seagulls to visit. This factor will undoubtedly play a crucial role in the upcoming Bournemouth vs Brighton encounter.
| Record Type | Played | Won | Drawn | Lost |
|---|---|---|---|---|
| Home Record (AFC Bournemouth at home) | 18 | 11 | 2 | 5 |
AFC Bournemouth Away Record vs Brighton
The tables turn when AFC Bournemouth travels to Brighton. Their away record against the Seagulls is considerably less favorable, indicating the challenge they face when away from their home support. This disparity underscores the importance of location in the South Coast Derby.
| Record Type | Played | Won | Drawn | Lost |
|---|---|---|---|---|
| Away Record (AFC Bournemouth away) | 16 | 3 | 4 | 9 |
Goals Analysis
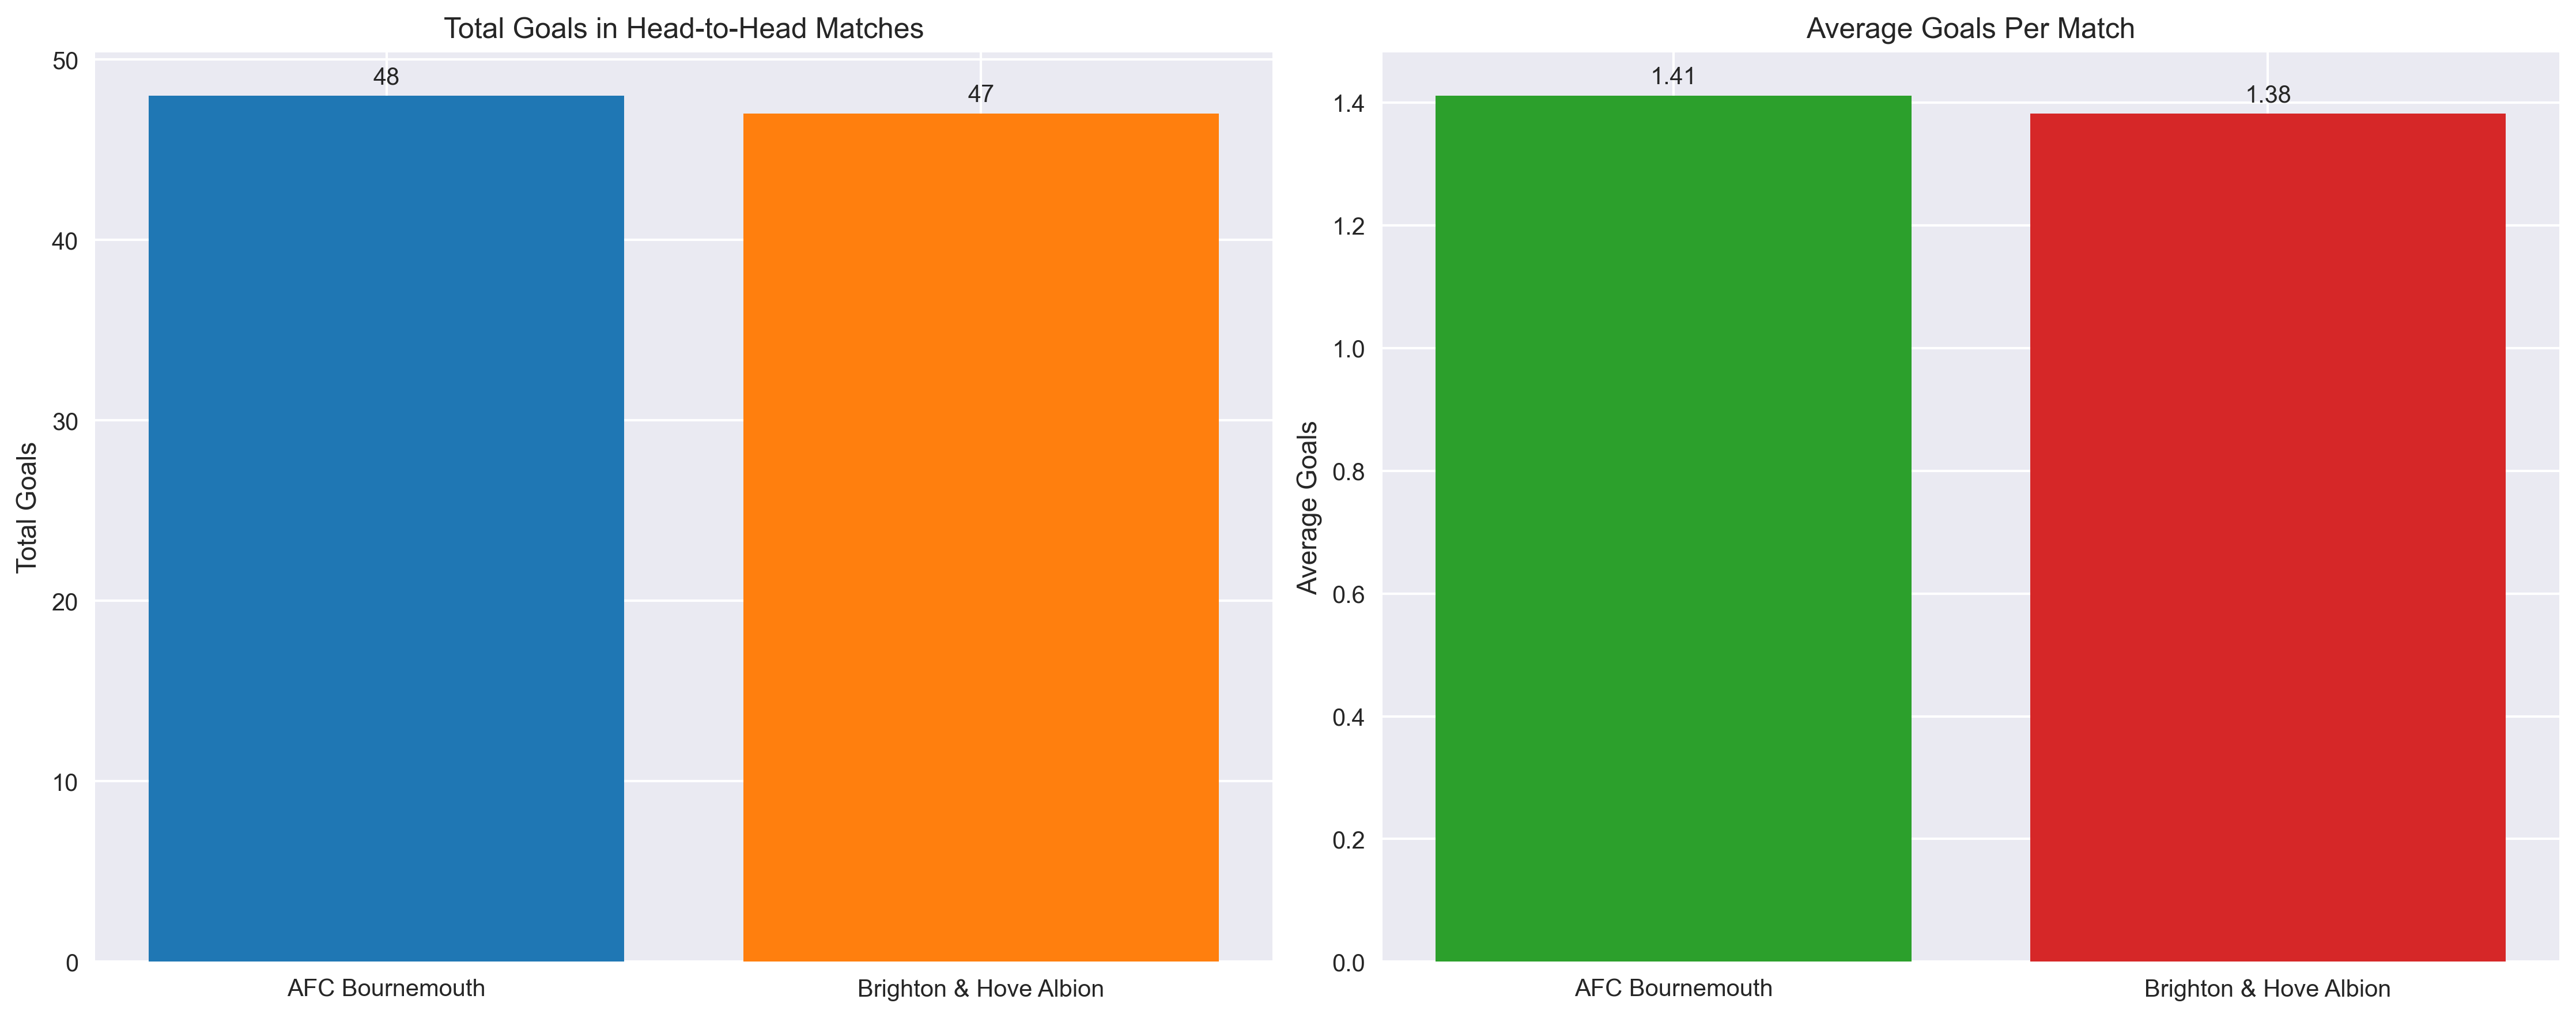
The goal-scoring statistics between these two sides reflect the tight nature of their rivalry. With AFC Bournemouth holding a marginal advantage in goals scored, it”s clear that matches are often decided by fine margins. This trend suggests that a single goal could be the difference in the upcoming Bournemouth vs Brighton fixture.
Both teams average well over a goal per game in their head-to-head encounters, indicating that goals are usually on the menu. However, the slightly higher average for Bournemouth at home, combined with Brighton”s goal-scoring prowess, hints at an exciting attacking display from both sides.
| Statistic | Value |
|---|---|
| AFC Bournemouth Goals | 48 (Avg: 1.41 per match) |
| Brighton & Hove Albion Goals | 47 (Avg: 1.38 per match) |
| Goal Difference | +1 (for AFC Bournemouth) |
Current Form & Momentum
Recent form is a critical indicator of a team”s current strength and confidence. Analyzing the last five matches for both AFC Bournemouth and Brighton & Hove Albion provides valuable insights into their current trajectory. This section will compare their recent performances, highlighting strengths and weaknesses that could influence the South Coast Derby.
Home Team: AFC Bournemouth
Bournemouth enters this match with a mixed but generally positive recent run, securing three wins from their last five outings. Their defensive solidity has been a notable feature, keeping three clean sheets in these matches. While their goal-scoring average is modest, their ability to grind out results, particularly at home, is evident.
The Cherries have shown resilience, especially in matches where they”ve managed to keep their opponents from scoring. Their 100% double chance (win or draw) record in the last five matches speaks volumes about their ability to avoid defeat. This defensive focus, combined with timely goals, has been key to their recent successes.
- Team: Bournemouth
- Last 5 matches:
- Goals For: 6, Avg: 1.2
- Goals Against: 6, Avg: 1.2
- Record: 3W-0D-2L
- Clean Sheets: 3
- Scored in Matches: 4/5
- Over 2.5 Goals: 1/5 (20.0%)
- Over 1.5 Goals: 60.0%
- Double Chance (Win or Draw): 100.0%
Bournemouth Last 5 Matches Overview
A closer look at Bournemouth”s recent fixtures reveals a pattern of tight games. They”ve demonstrated an ability to beat strong opposition, as seen in their victory over Tottenham, while also suffering defeats against high-scoring teams like Liverpool. Their EFL Cup exit against Brentford further highlights that every match is a challenge.
| Date | Comp | Opponent | Score | Result |
|---|---|---|---|---|
| 2025-05-25 | Premier League | Leicester City | 2 – 0 | W |
| 2025-08-15 | Premier League | Liverpool | 2 – 4 | L |
| 2025-08-23 | Premier League | Wolves | 1 – 0 | W |
| 2025-08-26 | EFL Cup | Brentford | 0 – 2 | L |
| 2025-08-30 | Premier League | Tottenham | 1 – 0 | W |
Away Team: Brighton & Hove Albion
Brighton arrives for the Bournemouth vs Brighton clash in formidable attacking form, netting an impressive 13 goals in their last five matches. Their average of 2.6 goals per game far surpasses Bournemouth”s recent output, showcasing their potent offensive capabilities. Despite a recent loss to Everton, their overall record of 3 wins and 1 draw indicates strong momentum.
The Seagulls have consistently found the back of the net, scoring in four out of five matches. Their tendency for high-scoring games is reflected in their 60% Over 2.5 goals rate and a perfect 100% Over 1.5 goals rate. This attacking flair, coupled with a solid defensive record of only 1.0 goals conceded per match, makes them a dangerous opponent.
- Team: Brighton And Hove Albion
- Last 5 matches:
- Goals For: 13, Avg: 2.6
- Goals Against: 5, Avg: 1.0
- Record: 3W-1D-1L
- Clean Sheets: 1
- Scored in Matches: 4/5
- Over 2.5 Goals: 3/5 (60.0%)
- Over 1.5 Goals: 100.0%
- Double Chance (Win or Draw): 80.0%
Brighton Last 5 Matches Overview
Brighton”s recent schedule has seen them face tough opposition and emerge with credit. Their commanding victory over Tottenham and a crucial win against Manchester City highlight their ability to perform against top-tier teams. The draw against Fulham and an EFL Cup thrashing of Oxford United further underline their current confidence and scoring ability.
| Date | Comp | Opponent | Score | Result |
|---|---|---|---|---|
| 2025-05-25 | Premier League | Tottenham | 4 – 1 | W |
| 2025-08-16 | Premier League | Fulham | 1 – 1 | D |
| 2025-08-24 | Premier League | Everton | 0 – 2 | L |
| 2025-08-27 | EFL Cup | Oxford United | 6 – 0 | W |
| 2025-08-31 | Premier League | Manchester City | 2 – 1 | W |
Key Statistical Analysis
Delving deeper into the numbers provides a clearer picture of the contrasting styles and current strengths of AFC Bournemouth and Brighton. This analytical comparison is crucial for understanding the potential dynamics of the upcoming Bournemouth vs Brighton fixture. We”ll examine their offensive and defensive metrics, as well as their propensity for certain match outcomes.
Offensive Comparison
Brighton clearly holds the upper hand in recent offensive output. Their average of 2.6 goals per game is more than double Bournemouth”s 1.2. This suggests a more fluid and clinical attack from the Seagulls. Brighton”s 100% scoring rate in Over 1.5 goals in their last five matches further emphasizes their consistent ability to find the net multiple times.
Bournemouth, while scoring in 4 out of 5 matches, tends to win by narrower margins, with only 20% of their games featuring Over 2.5 goals. This indicates that while they create chances, their conversion rate or overall attacking volume might be lower. Brighton”s 60% Over 2.5 rate points to a team that actively seeks to dominate and score freely.
Defensive Comparison
Defensively, Bournemouth has been more resolute in terms of clean sheets, managing three in their last five matches compared to Brighton”s one. This highlights Bournemouth”s ability to shut down opponents, especially when playing at home. Their average of 1.2 goals conceded is only slightly higher than Brighton”s 1.0, suggesting a generally solid defensive structure.
Brighton”s defense, despite conceding fewer goals on average, has been less successful in completely denying opponents, as evidenced by their single clean sheet. This could be due to a more expansive playing style that sometimes leaves them vulnerable at the back. The contrast in clean sheet numbers will be a key battleground in the Bournemouth vs Brighton match.
Overall Form and Momentum
Both teams share an identical win-draw-loss record of 3W-1D-1L (for Brighton, if we consider the draw and loss as single events) or 3W-0D-2L (for Bournemouth), indicating similar overall results. However, the manner in which they achieve these results differs significantly. Brighton”s high-scoring victories suggest a team brimming with confidence and attacking prowess, while Bournemouth”s tighter wins point to a more pragmatic and defensively organized approach.
Bournemouth”s 100% Double Chance (Win or Draw) in their last five matches is a strong indicator of their resilience and ability to avoid defeat, particularly at home. Brighton”s 80% Double Chance is also impressive, but slightly lower, suggesting they are marginally more susceptible to losses when things don”t go their way.
Betting Trends & Insights
Translating these statistics into actionable betting insights for the Bournemouth vs Brighton fixture requires careful consideration of each team”s recent patterns and historical head-to-head performance. The contrasting styles and recent forms offer several intriguing betting opportunities.
Goals Market Insights
- Over 1.5 Goals: Brighton”s 100% rate for Over 1.5 goals in their last five matches, combined with Bournemouth”s 60% rate and the historical H2H average goals per match (1.41 for Bournemouth, 1.38 for Brighton), makes Over 1.5 goals a very strong candidate for this match. Both teams have shown they can score, and Brighton, in particular, has been prolific.
- Over 2.5 Goals: Brighton”s 60% Over 2.5 rate is significant, suggesting they often partake in high-scoring affairs. However, Bournemouth”s much lower 20% rate for Over 2.5 goals introduces an element of caution. If Bournemouth can maintain their defensive solidity, this market might be riskier. The historical goal averages (around 1.4 per team) don”t overwhelmingly point to a high-scoring game unless Brighton truly dominates.
- Both Teams to Score (BTTS): With Bournemouth scoring in 4/5 and Brighton also scoring in 4/5 of their recent matches, BTTS looks like a plausible outcome. Both teams possess attacking talent, and while Bournemouth has kept clean sheets, Brighton”s goal-scoring form is difficult to contain.
Match Result & Double Chance Insights
- Double Chance (1X – Bournemouth Win or Draw): Bournemouth”s 100% Double Chance in their last five matches, coupled with their dominant home record against Brighton (11 wins, 2 draws in 18 games), makes a “Bournemouth Win or Draw” a very appealing bet. The Cherries clearly thrive at home in this derby.
- Double Chance (X2 – Draw or Brighton Win): Brighton”s 80% Double Chance also indicates their ability to avoid defeat. However, given Bournemouth”s strong home record in this specific fixture, this might be a slightly riskier bet compared to 1X, unless Brighton”s current attacking form is deemed overwhelmingly superior.
- Match Winner: The head-to-head record is perfectly balanced, but Bournemouth”s home advantage is undeniable. However, Brighton”s recent attacking prowess could challenge this. Betting on a straight win for either side carries higher risk given the historical parity and current contrasting forms.
Under/Over 3.5 Goals Insights
- Under 3.5 Goals: Given Bournemouth”s low 20% Over 2.5 rate and the historical goal averages which don”t scream goal-fest, Under 3.5 goals could be a sensible option. While Brighton can score, Bournemouth”s defensive focus, especially at home, might limit the overall goal count, pushing it below the 3.5 mark. This aligns with Bournemouth”s tendency for tighter matches.
Predicted Outcome
The Bournemouth vs Brighton fixture presents a fascinating clash of styles and recent momentum. AFC Bournemouth, with their strong home record against Brighton and recent defensive solidity, will look to leverage their home advantage. Their ability to secure results in tight games, as evidenced by their 100% double chance in recent matches, makes them a formidable opponent on their turf.
Brighton & Hove Albion, on the other hand, comes into this South Coast Derby in blistering attacking form, scoring goals freely and demonstrating a high propensity for Over 1.5 and Over 2.5 goal matches. Their offensive firepower is undeniable and will severely test Bournemouth”s defense.
Considering all the data, the historical head-to-head suggests a close encounter, but Bournemouth”s home dominance in this derby cannot be overlooked. However, Brighton”s current attacking output is a significant factor. It”s likely that Brighton will find the net, but Bournemouth”s defensive resilience, especially at home, means they are also likely to score or at least prevent a heavy defeat.
Predicted Outcome Focus:
- Over 1.5 Goals: Highly probable. Both teams have shown they can score, and Brighton”s recent form almost guarantees goals.
- Double Chance: AFC Bournemouth Win or Draw (1X): Strong likelihood. Bournemouth”s exceptional home record against Brighton and their current 100% double chance rate make this a very attractive and data-backed prediction.
While Brighton”s attack is potent, Bournemouth”s historical home advantage in this fixture, combined with their recent defensive displays and ability to avoid defeat, makes a home win or draw a compelling proposition. Goals are expected, primarily driven by Brighton”s offensive zeal, but Bournemouth”s knack for grinding out results at home should see them avoid a loss.
Conclusion
The upcoming Bournemouth vs Brighton match promises to be another gripping chapter in the South Coast Derby. Our in-depth statistical analysis highlights a fixture steeped in history, characterized by an almost perfectly balanced head-to-head record, yet heavily influenced by home advantage for the Cherries. Bournemouth”s defensive resilience and strong home form against Brighton clash with the Seagulls” explosive recent attacking output.
Key insights suggest that while Brighton will pose a significant attacking threat, Bournemouth”s ability to perform at home makes them difficult to beat. The goal statistics lean towards an encounter with at least two goals, making the Over 1.5 goals market particularly appealing. Furthermore, considering Bournemouth”s remarkable home record in this fixture and their recent ability to avoid defeat, a Double Chance (AFC Bournemouth Win or Draw) emerges as a robust prediction.
This match is more than just a game; it”s a tactical battle where historical trends meet current form. For fans and bettors alike, the Bournemouth vs Brighton encounter will offer plenty of excitement, with the data pointing towards a closely contested match where the home side has a strong chance of securing points, and goals are certainly on the agenda.

